
Insights · So what?
See which differences are real, before you export to a spreadsheet.
Pick a question and compare it by channel or by another question. AutoSurvey tests each difference. A card lists up to three differences that pass the test, in plain sentences. Groups that are too small show "Not enough data".
Insights is for customer experience and operations questions. It does not replace a full research suite.
Survey charts often do not say if a change is more than chance. So teams export to a spreadsheet to find out. The Insights page on each survey now answers the next question: so what?
Pick a release and a closed month. Then pick a question, a "Compare by" and a confidence level. AutoSurvey shows "3 things that stand out", a Compare by table and a crosstab. Every number comes from a standard statistical test. No AI makes or changes a number.
Compare by channel or by a question.
Compare a choice question by the channel that sent the survey, or by another single-choice question. For example, satisfaction by email, text message and web link.
Small groups say so.
A percent or a test needs at least 30 answers in the group and in the rest. An NPS score needs 20. When fewer than 5 people answered, Insights shows "Not enough data" and no numbers.
Up to three findings, in plain words.
Each finding is one sentence: the group, the answer, higher or lower, and the two percents. Small text shows both group sizes, the test and the month.
The screens
These are design mockups. They use sample data for a fictional visit survey.
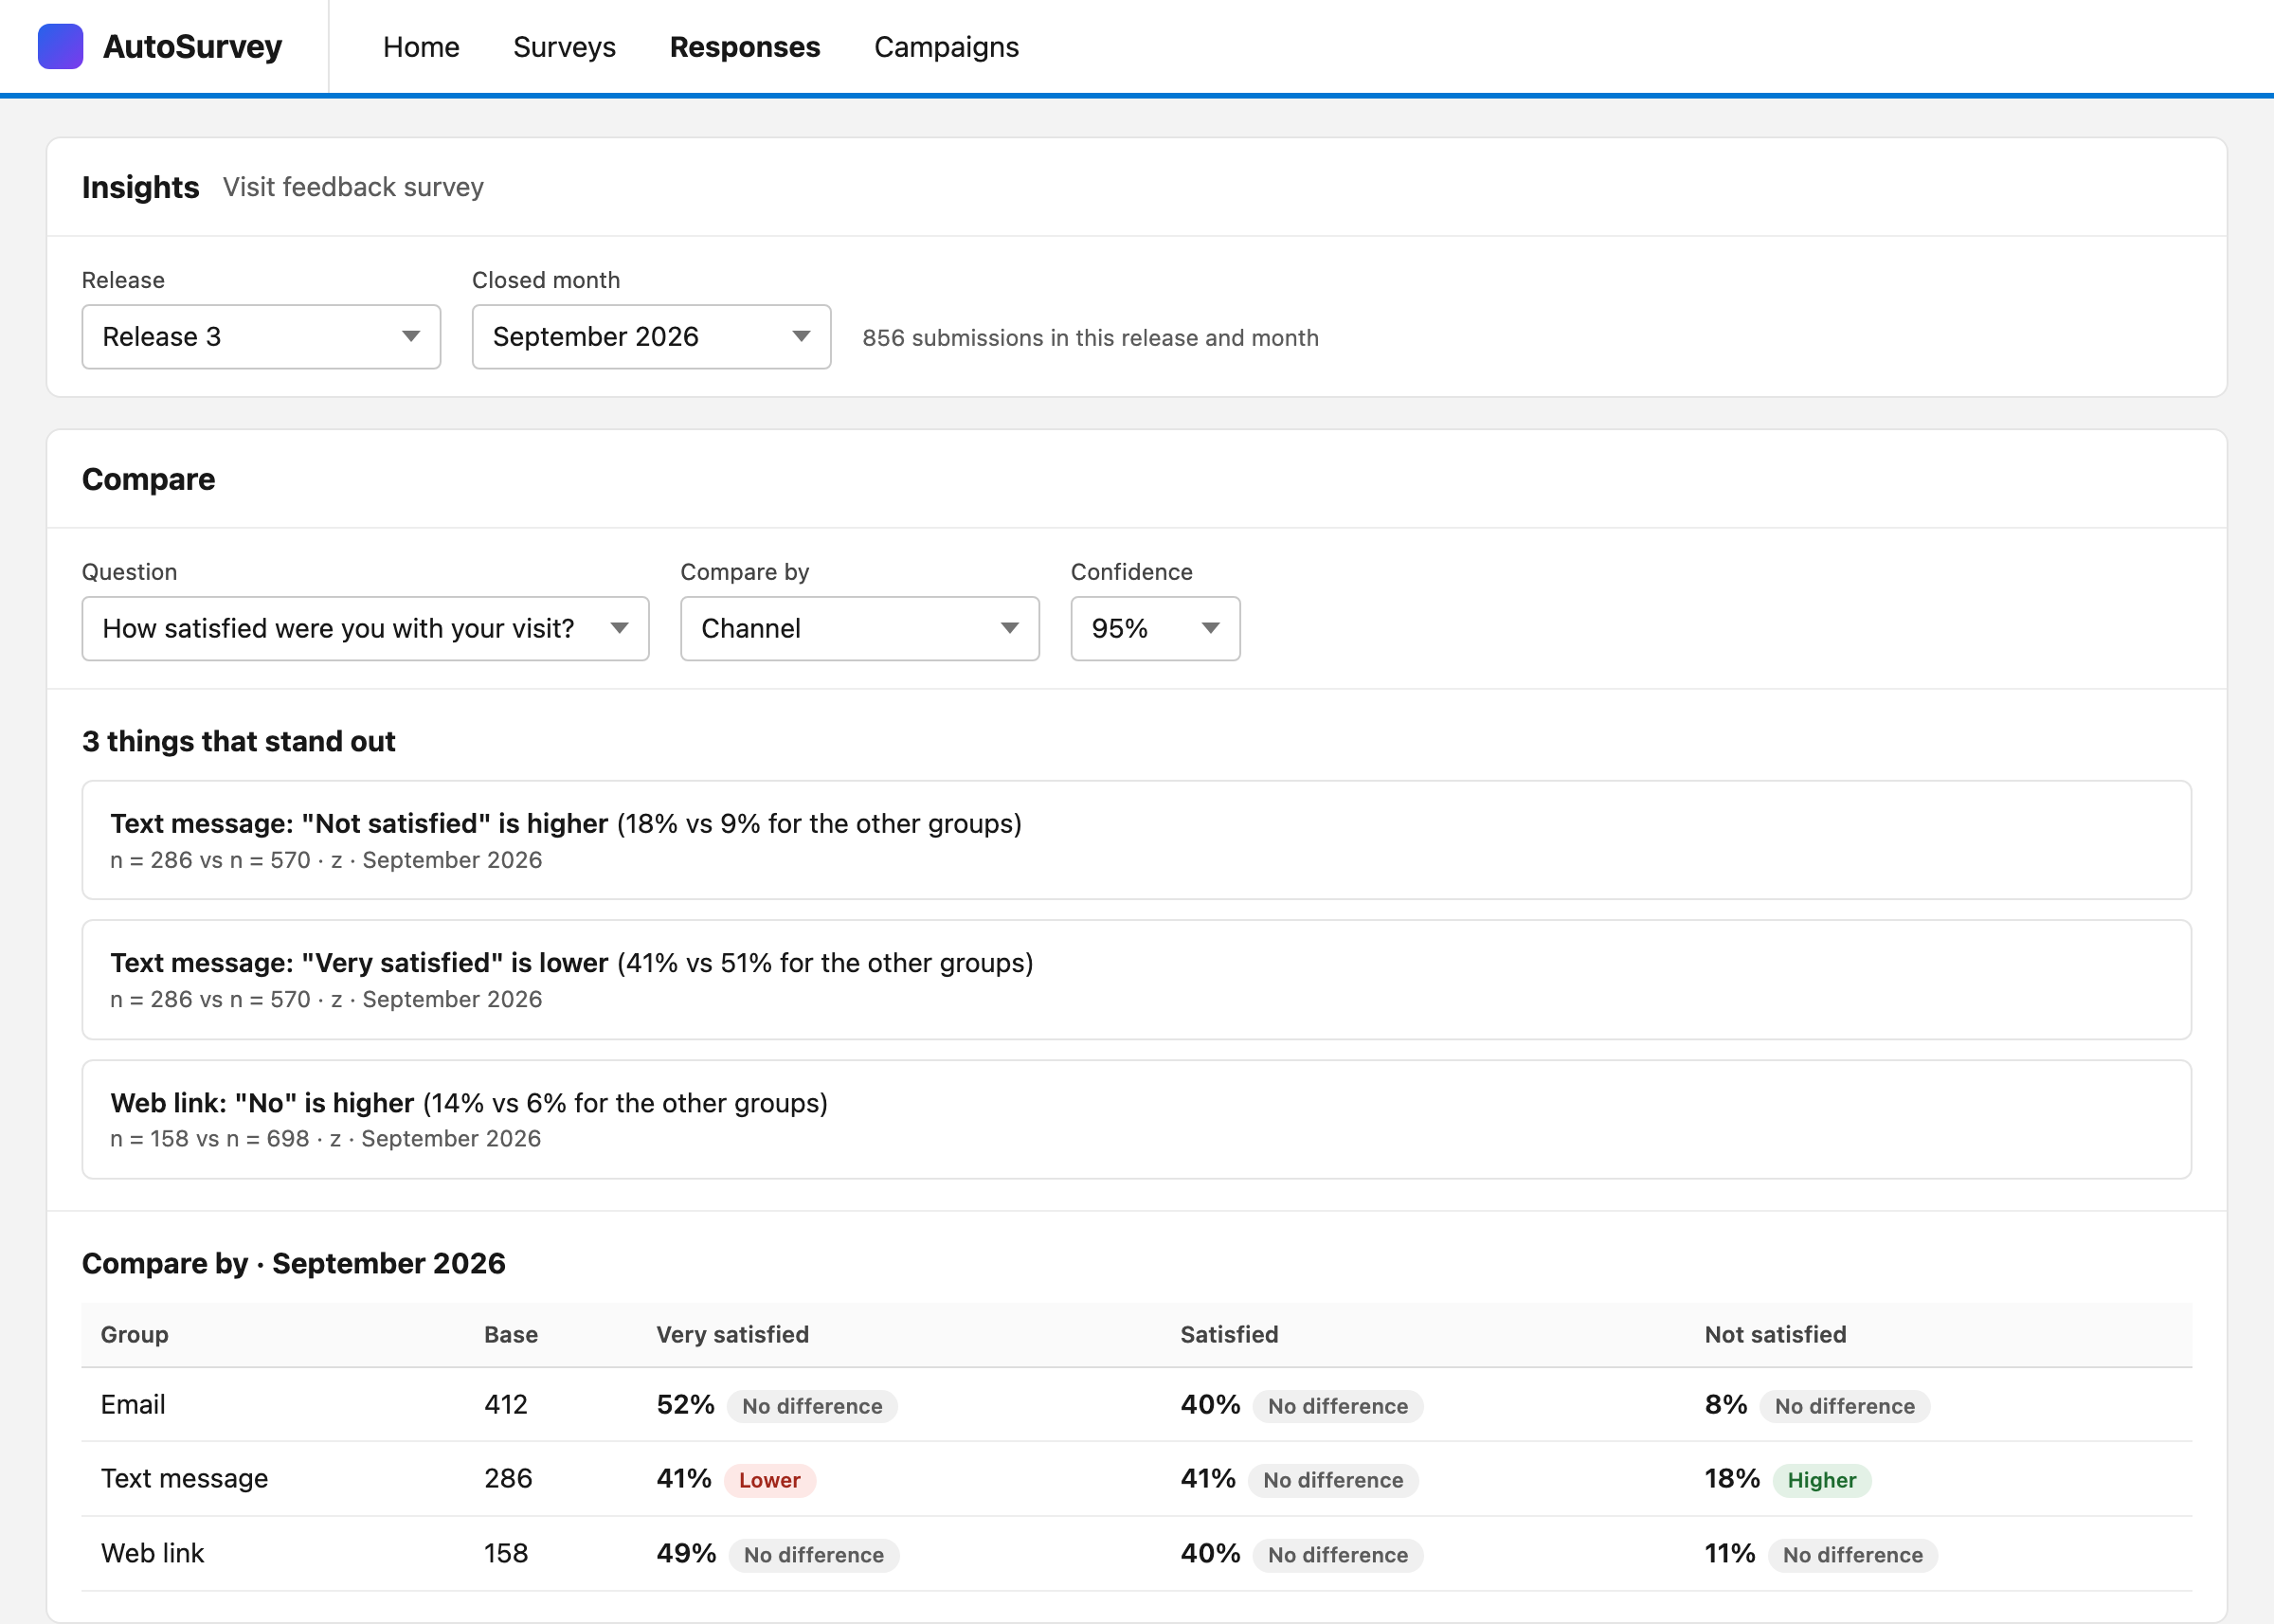
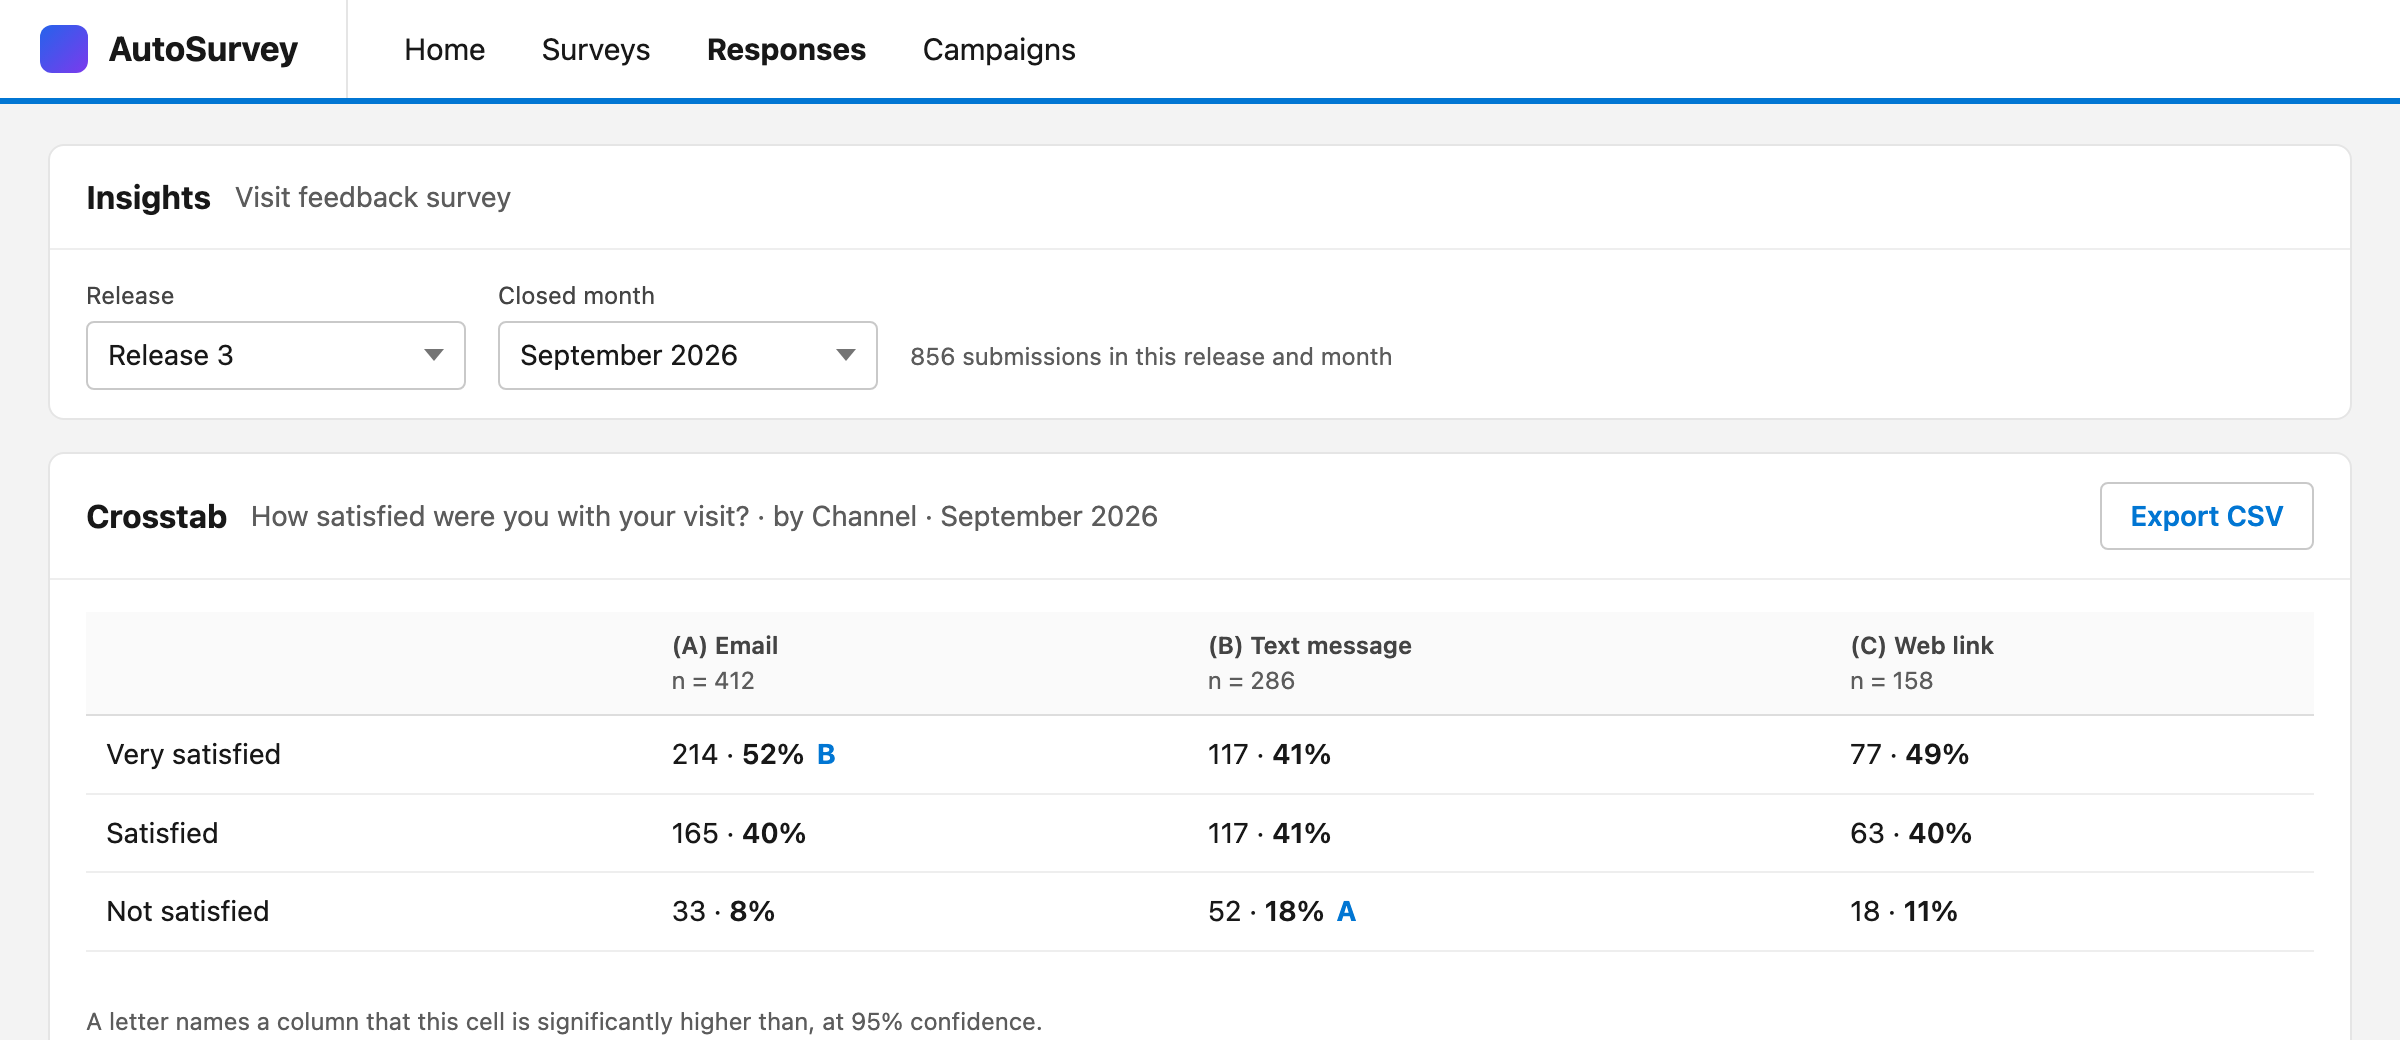
What it does, and what it does not do
What Insights does
- Shows one release and one closed month at a time, so every count covers the same people.
- Compares a single-choice question by channel or by another single-choice question, with up to 12 groups.
- Uses a two-proportion z-test. When a group is too small for that test, it uses Fisher's exact test.
- Corrects for the number of checks (Holm), so more checks do not give more false findings.
- Shows a crosstab with counts, column percents and significance letters, at 95% or 99% confidence.
- Exports the crosstab counts as a CSV file.
- Hides a whole crosstab when a cell has 1 to 4 responses, so a small group cannot be found.
What it does not do
- It does not compare by a field on the Salesforce record, or by release.
- It does not compare means or NPS scores between groups.
- It does not show the current month. It shows closed months only.
- It does not compare a month with more than 5,000 responses.
- It does not say why a difference exists. A finding is a signal to look at, not a proven cause.
- It does not use AI for any number or finding sentence.
- It does not export XLSX or open the Salesforce report builder.
Base (n)
The number of people that a percent counts. "52% of 412" has a base of 412.
Significant
The difference is large enough, for the number of people, that chance is an unlikely cause. The default is 95% confidence.
Closed month
A calendar month that has ended. Insights does not show the current month, because its numbers still change.
Is that drop real, or is it twelve people?
Bring one survey that your team exports to a spreadsheet today. We will walk through Insights with you on that survey and answer your questions.
All data on these mockups is sample data for a fictional visit survey.